| News |
|
| Eric J. Lerner |
| What's wrong with the
electric grid? |
|
The warnings were certainly there. In 1998, former
utility executive John Casazza predicted that “blackout risks will be
increased” if plans for deregulating electric power went ahead. And the
warnings continued to be heard from other energy experts and planners.
So it could not have been a great surprise to the
electric-power industry when, on August 14, a blackout that covered
much of the Northeast United States dramatically confirmed these
warnings. Experts widely agree that such failures of the
power-transmission system are a nearly unavoidable product of a
collision between the physics of the system and the economic rules that
now regulate it. To avoid future incidents, the nation must either
physically transform the system to accommodate the new rules, or change
the rules to better mesh with the power grid’s physical behavior.
 Understanding the grid’s
problems starts with its physical behavior. The vast system of
electricity generation, transmission, and distribution that covers the
United States and Canada is essentially a single machine— by many
measures, the world’s biggest machine. This single network is
physically and administratively subdivided into three “interconnects”—
the Eastern, covering the eastern two-thirds of the United States and
Canada; the Western, encompassing most of the rest of the two
countries; and the Electric Reliability Council of Texas (ERCOT),
covering most of Texas (Figure 1). Within each interconnect, power
flows through ac lines, so all generators are tightly synchronized to
the same 60-Hz cycle. The interconnects are joined to each other by dc
links, so the coupling is much looser among the interconnects than
within them. (The capacity of the transmission lines between the
interconnects is also far less than the capacity of the links within
them.) Understanding the grid’s
problems starts with its physical behavior. The vast system of
electricity generation, transmission, and distribution that covers the
United States and Canada is essentially a single machine— by many
measures, the world’s biggest machine. This single network is
physically and administratively subdivided into three “interconnects”—
the Eastern, covering the eastern two-thirds of the United States and
Canada; the Western, encompassing most of the rest of the two
countries; and the Electric Reliability Council of Texas (ERCOT),
covering most of Texas (Figure 1). Within each interconnect, power
flows through ac lines, so all generators are tightly synchronized to
the same 60-Hz cycle. The interconnects are joined to each other by dc
links, so the coupling is much looser among the interconnects than
within them. (The capacity of the transmission lines between the
interconnects is also far less than the capacity of the links within
them.)
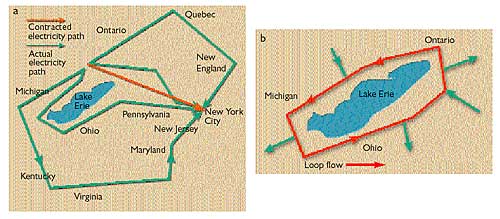 |
| Figure
2. Electric power does not travel just by the shortest route
from source to sink, but also by parallel flow paths through other
parts of the system (a). Where the network jogs around large
geographical obstacles, such as the Rocky Mountains in the West or the
Great Lakes in the East, loop flows around the obstacle are set up that
can drive as much as 1 GW of power in a circle, taking up transmission
line capacity without delivering power to consumers (b). |
Prior to deregulation, which began in the 1990s,
regional and local electric utilities were regulated, vertical
monopolies. A single company controlled electricity generation,
transmission, and distribution in a given geographical area. Each
utility generally maintained sufficient generation capacity to meet its
customers’ needs, and long-distance energy shipments were usually
reserved for emergencies, such as unexpected generation outages. In
essence, the long-range connections served as insurance against sudden
loss of power. The main exception was the net flows of power out of the
large hydropower generators in Quebec and Ontario.
This limited use of long-distance connections aided
system reliability, because the physical complexities of power
transmission rise rapidly as distance and the complexity of
interconnections grow. Power in an electric network does not travel
along a set path, as coal does, for example. When utility A agrees to
send electricity to utility B, utility A increases the amount of power
generated while utility B decreases production or has an increased
demand. The power then flows from the “source” (A) to the “sink” (B)
along all the paths that can connect them. This means that changes in
generation and transmission at any point in the system will change
loads on generators and transmission lines at every other point—often
in ways not anticipated or easily controlled (Figure 2).
To avoid system failures, the amount of power flowing
over each transmission line must remain below the line’s capacity.
Exceeding capacity generates too much heat in a line, which can cause
the line to sag or break or can create power-supply instability such as
phase and voltage fluctuations. Capacity limits vary, depending on the
length of the line and the transmission voltage (Table 1). Longer lines
have less capacity than shorter ones.
In addition, for an ac power grid to remain stable, the
frequency and phase of all power generation units must remain
synchronous within narrow limits. A generator that drops 2 Hz below 60
Hz will rapidly build up enough heat in its bearings to destroy itself.
So circuit breakers trip a generator out of the system when the
frequency varies too much. But much smaller frequency changes can
indicate instability in the grid. In the Eastern Interconnect, a 30-mHz
drop in frequency reduces power delivered by 1 GW.
If certain parts of the grid are carrying electricity at
near capacity, a small shift of power flows can trip circuit breakers,
which sends larger flows onto neighboring lines to start a
chain-reaction failure. This happened on Nov. 10, 1965, when an
incorrectly set circuit breaker tripped and set off a blackout that
blanketed nearly the same area as the one in August.
After the 1965 blackout, the industry set up regional
reliability councils, coordinated by the North American Electric
Reliability Council, to set standards to improve planning and
cooperation among the utilities. A single-contingency-loss standard was
set up to keep the system functioning if a single unit, such as a
generator or transition line, went out. Utilities built up spare
generation and transmission capacity to maintain a safety margin.
In 1992, the economic rules governing the grid began to
change with passage of the Energy Policy Act. This law empowered the
Federal Energy Regulatory Commission (FERC) to separate electric power
generation from transmission and distribution. Power deregulation—in
reality, a change in regulations—went slowly at first. Not until 1998
were utilities, beginning in California, compelled to sell off their
generating capacity to independent power producers, such as Enron and
Dynergy.
 |
| Table
2. Prior to the implementation of Federal Energy Regulatory
Commission Order 888, which greatly expanded electricity trading, the
cost of electricity, excluding fuel costs, was gradually falling.
However, after Order 888, and some retail deregulation, prices
increased by about 10%, costing consumers $20 billion a year. |
The new regulations envisioned trading electricity like
a commodity. Generating companies would sell their power for the best
price they could get, and utilities would buy at the lowest price
possible. For this concept to work, it was imperative to compel
utilities that owned transmission lines to carry power from other
companies’ generators in the same way as they carried their own, even
if the power went to a third party. FERC’s Order 888 mandated the
wheeling of electric power across utility lines in 1996. But that order
remained in litigation until March 4, 2000, when the U.S. Supreme Court
validated it and it went into force.
In the four years between the issuance of Order 888 and
its full implementation, engineers began to warn that the new rules
ignored the physics of the grid. The new policies “ do not recognize
the single-machine characteristics of the electric-power network,”
Casazza wrote in 1998. “The new rule balkanized control over the single
machine,” he explains. “It is like having every player in an orchestra
use their own tunes.”
In the view of Casazza and many other experts, the key
error in the new rules was to view electricity as a commodity rather
than as an essential service. Commodities can be shipped from point A
through line B to point C, but power shifts affect the entire
singlemachine system. As a result, increased longdistance trading of
electric power would create dangerous levels of congestion on
transmission lines where controllers did not expect them and could not
deal with them.
The problems would be compounded, engineers warned, as
independent power producers added new generating units at essentially
random locations determined by low labor costs, lax local regulations,
or tax incentives. If generators were added far from the main consuming
areas, the total quantity of power flows would rapidly increase,
overloading transmission lines. “ The system was never designed to
handle long-distance wheeling,” notes Loren Toole, a
transmission-system analyst at Los Alamos National Laboratory.
At the same time, data needed to predict and react to
system stress—such as basic information on the quantity of energy
flows—began disappearing, treated by utilities as competitive
information and kept secret. “Starting in 1998, the utilities stopped
reporting on blackout statistics as well,” says Ben Carreras of Oak
Ridge National Laboratory, so system reliability could no longer be
accurately assessed.
Finally, the separation into generation and transmission
companies resulted in an inadequate amount of reactive power, which is
current 90 deg out of phase with the voltage. Reactive power is needed
to maintain voltage, and longer-distance transmission increases the
need for it. However, only generating companies can produce reactive
power, and with the new rules, they do not benefit from it. In fact,
reactive-power production reduces the amount of deliverable power
produced. So transmission companies, under the new rules, cannot
require generating companies to produce enough reactive power to
stabilize voltages and increase system stability.
The net result of the new rules was to more tightly
couple the system physically and stress it closer to capacity, and at
the same time, make control more diffuse and less coordinated—a
prescription, engineers warned, for blackouts.
In March 2000, the warnings began to come true. Within a
month of the Supreme Court decision implementing Order 888, electricity
trading skyrocketed, as did stresses on the grid (Figure 3). One
measure of stress is the number of transmission loading relief
procedures (TLRs)—events that include relieving line loads by shifting
power to other lines. In May 2000, TLRs on the Eastern Interconnect
jumped to 6 times the level of May 1999. Equally important, the
frequency stability of the grid rapidly deteriorated, with average
hourly frequency deviations from 60 Hz leaping from 1.3 mHz in May
1999, to 4.9 mHz in May 2000, to 7.6 mHz by January 2001. As predicted,
the new trading had the effect of overstressing and destabilizing the
grid.
“Under the new system, the financial incentive was to
run things up to the limit of capacity,” explains Carreras. In fact,
energy companies did more: they gamed the system. Federal
investigations later showed that employees of Enron and other energy
traders “knowingly and intentionally” filed transmission schedules
designed to block competitors’ access to the grid and to drive up
prices by creating artificial shortages. In California, this behavior
resulted in widespread blackouts, the doubling and tripling of retail
rates, and eventual costs to ratepayers and taxpayers of more than $30
billion. In the more tightly regulated Eastern Interconnect, retail
prices rose less dramatically.
After a pause following Enron’s collapse in 2001 and a
fall in electricity demand (partly due to recession and partly to
weather), energy trading resumed its frenzy in 2002 and 2003. Although
power generation in 2003 has increased only 3% above that in 2000,
generation by independent power producers, a rough measure of wholesale
trading, has doubled. System stress, as measured by TLRs and frequency
instability, has soared, and with it, warnings by FERC and other
groups.
 |
|
Figure 3. After
wholesale electricity trading began in earnest following Federal Energy
Regulatory Commission’s Order 888, stress on the transmission grid
jumped and continued to climb, as shown by the transmission loading
relief procedures (a) and the monthly average frequency errors (b).
|
Major bank and investment institutions such as Morgan
Stanley and Citigroup stepped into the place of fallen traders such as
Enron and began buying up power plants. But as more players have
entered and trading margins have narrowed, more trades are needed to
pay off the huge debts incurred in buying and building generators.
Revenues also have shrunk, because after the California debacle, states
have refused to substantially increase the rates consumers pay. As
their credit ratings and stock prices fell, utility companies began to
cut personnel, training, maintenance, and research. Nationwide, 150,000
utility jobs evaporated. “We have a lot of utilities in deep financial
trouble,” says Richard Bush, editor of Transmission and
Distribution, a trade magazine.
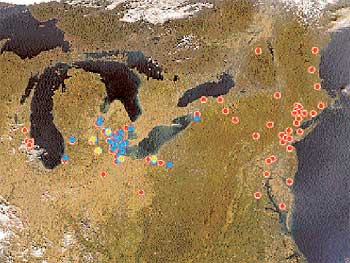
The August 14 blackout, although set off by specific
chance events, became the logical outcome of these trends (Figure 4).
Controllers in Ohio, where the blackout started, were overextended,
lacked vital data, and failed to act appropriately on outages that
occurred more than an hour before the blackout. When energy shifted
from one transmission line to another, overheating caused lines to sag
into a tree. The snowballing cascade of shunted power that rippled
across the Northeast in seconds would not have happened had the grid
not been operating so near to its transmission capacity.
How to fix it
The conditions that caused the August 14th blackout remain in place. In
fact, the number of TLRs and the extent of frequency instability
remained high after August 14 until September’s cool weather reduced
stress on the grid. What can be done to prevent a repetition next
summer?
One widely supported answer is to change the grid
physically to accommodate the new trading patterns, mainly by expanding
transmission capacity. The DOE and FERC, as well as organizations
supported by the utilities, such as the Electric Power Research
Institute and the Edison Electric Institute, advocate this approach. In
reports before and after the blackout, they urged expanding
transmission lines and easing environmental rules that limit their
construction. The logic is simple: if increased energy trading causes
congestion and, thus, unreliability, expand capacity so controllers can
switch energy from line to line without overloading.
 |
|
Figure 4.
Blackout sequence of events, August 14, 2003
1:58 p.m. The Eastlake,
Ohio, generating plant shuts down. The plant is owned by First Energy,
a company that had experienced extensive recent maintenance problems,
including a major nuclear-plant incident.
3:06 p.m. A First Energy 345-kV
transmission line fails south of Cleveland, Ohio.
3:17 p.m. Voltage dips
temporarily on the Ohio portion of the grid. Controllers take no
action, but power shifted by the first failure onto another power line
causes it to sag into a tree at 3:32 p.m., bringing it offline as well.
While Mid West ISO and First Energy controllers try to understand the
failures, they fail to inform system controllers in nearby states.
3:41 and 3:46 p.m. Two breakers
connecting First Energy’s grid with American Electric Power are
tripped.
4:05 p.m. A sustained power
surge on some Ohio lines signals more trouble building.
4:09:02 p.m. Voltage sags
deeply as Ohio draws 2 GW of power from Michigan.
4:10:34 p.m. Many transmission
lines trip out, first in Michigan and then in Ohio, blocking the
eastward flow of power. Generators go down, creating a huge power
deficit. In seconds, power surges out of the East, tripping East coast
generators to protect them, and the blackout is on.
(Orbital Imaging Corp;
processing by NASA Goddard Space Flight Center)
|
To pay the extensive costs, the utilities and the DOE
advocate increases in utility rates. “The people who benefit from the
system have to be part of the solution here,” Energy Secretary Spencer
Abrams said during a television interview. “That means the ratepayers
are going to have to contribute.” The costs involved would certainly be
in the tens of billions of dollars. Thus, deregulation would result in
large cost increases to consumers, not the savings once promised (Table
2).
But experts outside the utility industry point to
serious drawbacks in the build-more solution other than increasing the
cost of power. For one, it is almost impossible to say what level of
capacity will accommodate the long-distance wholesale trading. The data
needed to judge that is now proprietary and unavailable in detail. Even
if made available to planners, this data refers only to the present.
Transmission lines take years to build, but energy flows can expand
rapidly to fill new capacity, as demonstrated by the jump in trading in
the spring of 2000. New lines could be filled by new trades as fast as
they go up.
The solution advocated by deregulation critics would
revise the rules to put them back into accord with the grid physics. “
The system is not outdated, it is just misused,” says Casazza. “We
should look hard at the new rules, see what is good for the system as a
whole, and throw out the rest.” Some changes could be made before next
summer, and at no cost to ratepayers. For one thing, FERC or Congress
could rescind Order 888 and reduce the long-distance energy flows that
stress the system. Second, the data on energy flows and blackouts could
again be made public so that planners would know what power flows are
occurring and the reliability records of the utilities. Other changes,
such as rehiring thousands of workers to upgrade maintenance, would
take longer and might require rewriting regulations and undoing more of
the 1992 Energy Act.
These changes also would have costs, but they would be
borne by the shareholders and creditors of the banks and energy
companies who bet so heavily on energy trading. With cash flows
dwindling and debt levels high, many of these companies or their
subsidiaries might face bankruptcy if energy trading is curtailed. The
decision will ultimately fall to Congress, where hearings are scheduled
for the fall. However the decision turns out, what is nearly certain is
that until fixed, the disconnect between the grid’s economics and
physics will cause more blackouts in the future.
Further reading
Casazza, J. A. Blackouts: Is the Risk Increasing? Electrical World
1998, 212 (4), 62–64.
Casazza, J. A.; Delea, F. Understanding Electric Power Systems: An
Overview of the Technology and the Marketplace; Wiley: New York,
2003; 300 pp.
Hale, D. R. Transmission Data and Analysis: How Loose is the
Connection?; available here.
Loose, V. W.; Dowell, L. J. Economic and Engineering Constraints on the
Restructuring of the Electric Power Industry; available
here.
Mountford, J. D.; Austria, R. R. Power Technologies Inc. Keeping the
lights on! IEEE Spectrum 1999, 36 (6), 34–39.
National Transmission Grid Study Report; available here.
Tucker, R. J. Facilitating Infrastructure Development: A Critical Role
for Electric Restructuring. Presented at the National Energy Modeling
System/Annual Energy Outlook Conference, Washington, DC, March 10,
2003; available
here.
|